I've been to a few knowledge sharing, networking events, over at the Technopole in Portsmouth hosted by the South Coast Centre of Excellence in Satellite Applications. I wanted to learn more about the Space domain, especially with regards to work and opportunities at the Dorset Innovation Park where we are already involved in the Land, Sea, Air and Cyber domains.
Only starting to understand the wide range of satellite applications and it has moved away from the pure comms side of things into data. Everything is data and what insight and intelligence you can get from it, for both societal and security purposes.
One particular session really caught my mind and that was by 4 Earth Intelligence. The day centred around air quality and it really brought home the idea that bad air quality is a public health burden. It's not just a hazy day every now and again. Living close to congested roads, roundabouts and crossings, means you are enveloped in the pollution and particulates every day of the year. Your lungs will be in continual decline, whether slowly or quickly, if you don't get respite from it.
There was a doctor that did a quite technical/medical presentation but you could understand the issues if not the phrases.
Using satellite data and low level ground monitoring, there could be better data and warnings shared on a much more granular basis. For example, in busy city streets where air quality and pollution poses even more of a risk, when levels get too high, smart controls in smart digital cities could kick in that make certain streets EV only, or their could be technology that tells hybrids to switch to electricity only. As a starter, heavy council vehicles could be retro fitted with small enough batteries to enable 1 mile of electric running, so they can switch when notified. Every little helps as they say.
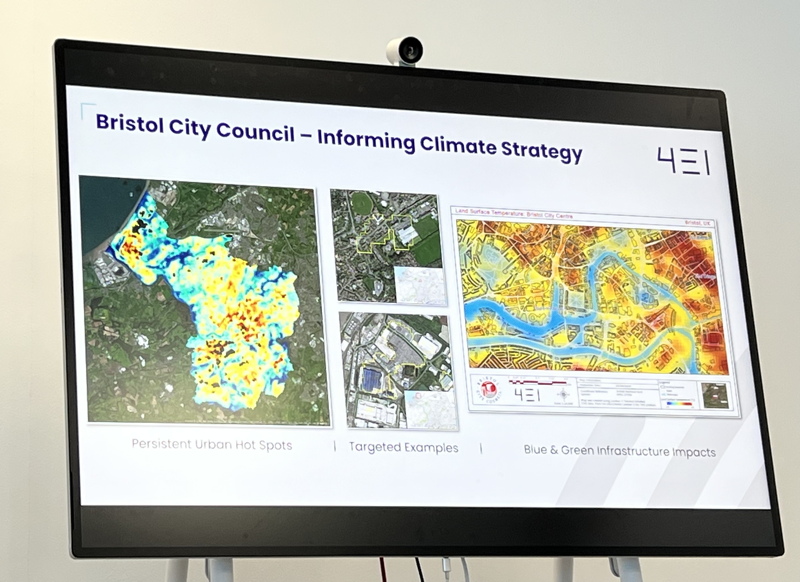
This is a tool on the BBC site by 4EI that shows the risks of heat that can be exacerbated by local infrastructure. Take a look at where you live.
Check your area's vulnerability to extreme heat - BBC website, heat article
This next page wasn't the tool that could drill down to street level but can give you a bigger overview of your area.
Check all sorts of emissions data for your local area - National Atmospheric Emissions Inventory
In future, people might want to look at these tools or similar, when they look for a new home, rather than just considering the school catchment area. It may be that homes in cleaner air, with cooler surrounds go up in value and not because of schools.

The image above shows the make up of London's air pollution.
